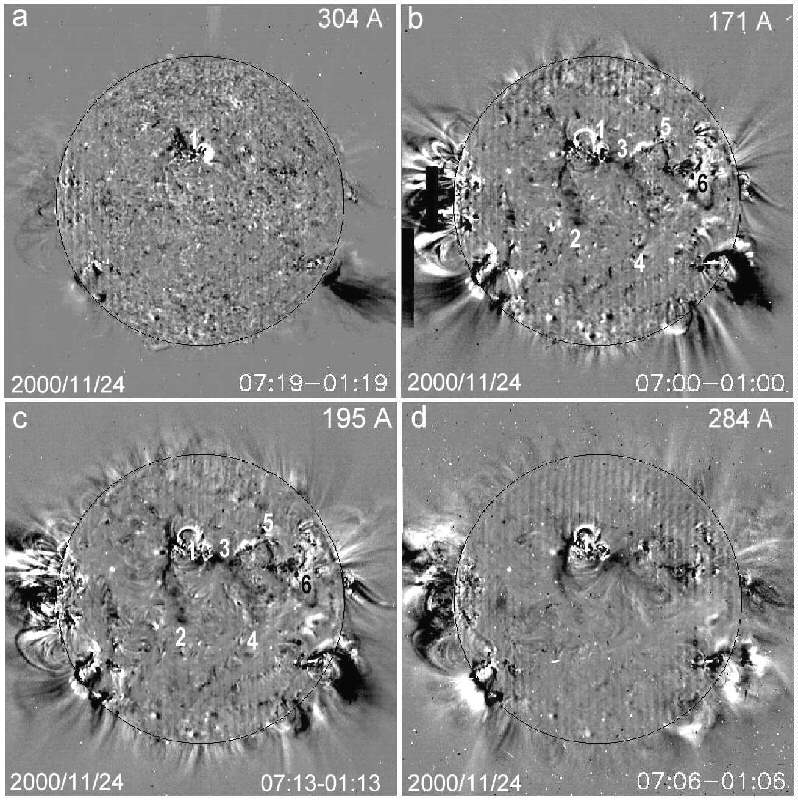
Figure 3. SOHO/EIT rotated difference full-disk images with 6-hour intervals showing large-scale dimming manifestations in event a of the series in the coronal lines 171, 195, 284 A (b–d) and the transition-region line 304 A (a).
Figure 3. SOHO/EIT rotated difference full-disk images with 6-hour intervals showing large-scale dimming manifestations in event a of the series in the coronal lines 171, 195, 284 A (b–d) and the transition-region line 304 A (a).