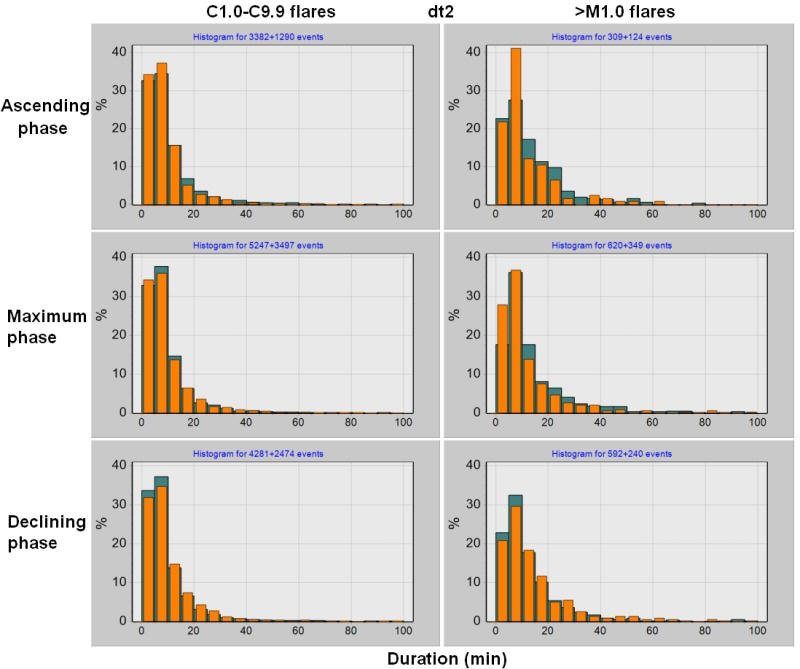
Figure 4s (2). Histograms characterizing the relative distributions (percent) of the moderate C1.0÷C9.9 class flares (left row) and the most intense ≥M1.0-class flares (right row) by the decay time (dt2) at the ascending, maximum and declining phases of cycles 23 (green bins) and 24 (orange bins).